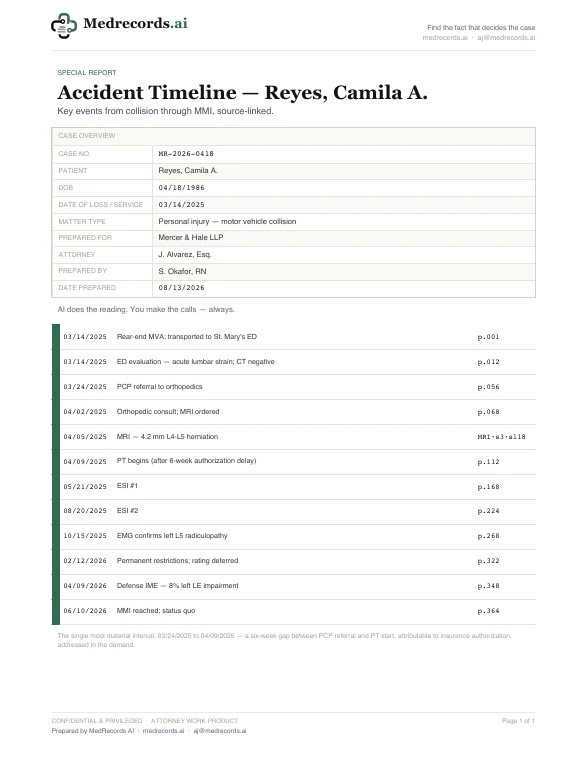
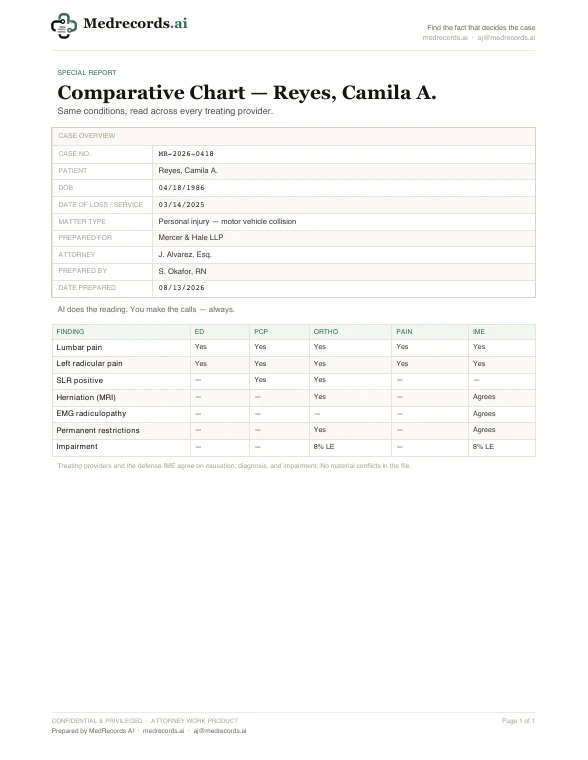
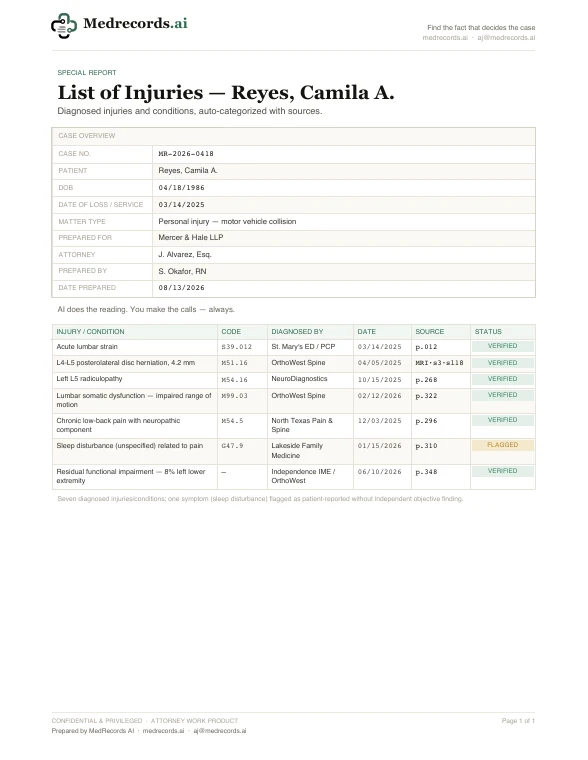
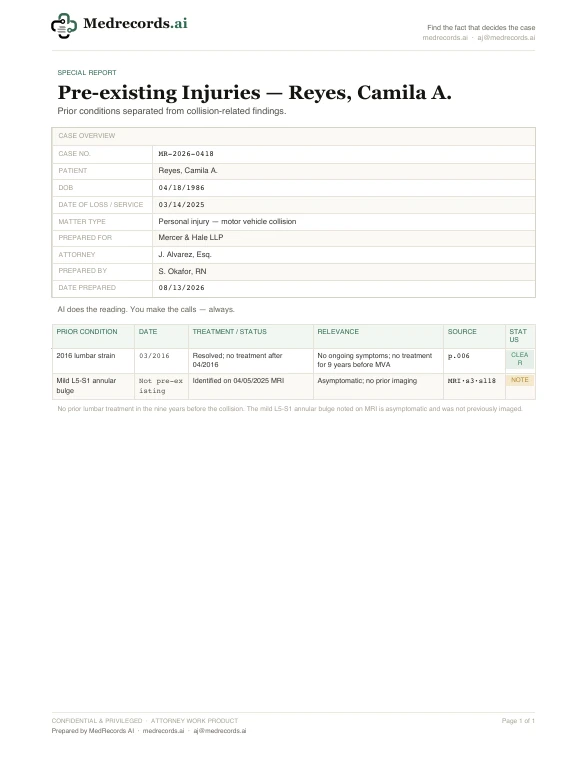
Pain & Suffering Chart Sample
A chart lining up every pain-scale rating documented in the record against the treatment milestones around it, so a reviewer can see whether reported pain tracked, worsened, or improved relative to specific interventions instead of scanning separate visit notes for the same data point.
What’s inside
- Every documented pain-scale rating plotted
- Ratings lined up against treatment milestones
- Trend visible at a glance, not buried across visits
- Every data point cited to its source page
This is a real Medrecords AI work product on a fictional, company-branded demo case, not a template or a mockup. Open the PDF to see the actual formatting, citations, and structure a case team receives.
How Medrecords AI does this work
See how Medrecords AI turns scattered pain-scale entries into one cited chart.
SolutionPersonal Injury PlaintiffSee how Medrecords AI turns scattered pain-scale entries into one cited chart.Read more →ProductVerifiable AI citationsIf we can't cite it, we don't say it. Click any line to its source.Read more →BrowseAll 41 samples and toolsReports, chronologies, expert opinions, plus free templates and tools.Read more →
Test it on a file you already have.
Send one real record set. You get back a cited chronology and decide for yourself whether the read holds up — no obligation either way.