Treatment Chart Sample
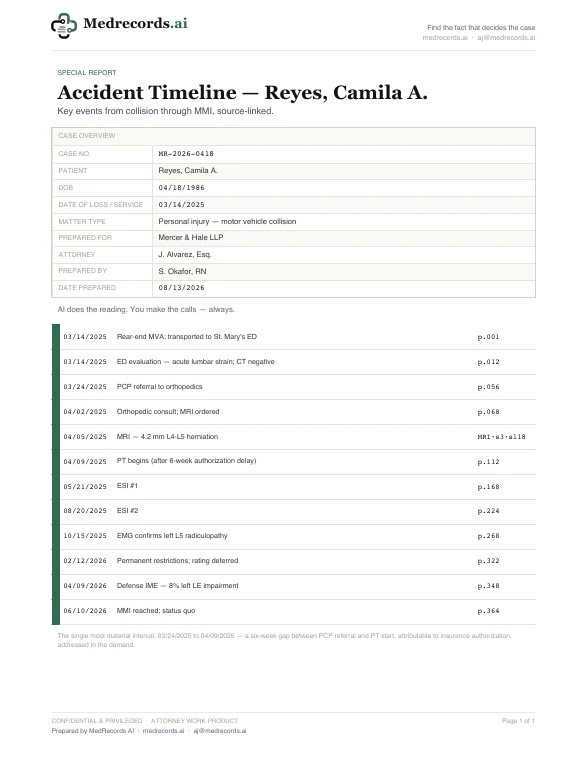
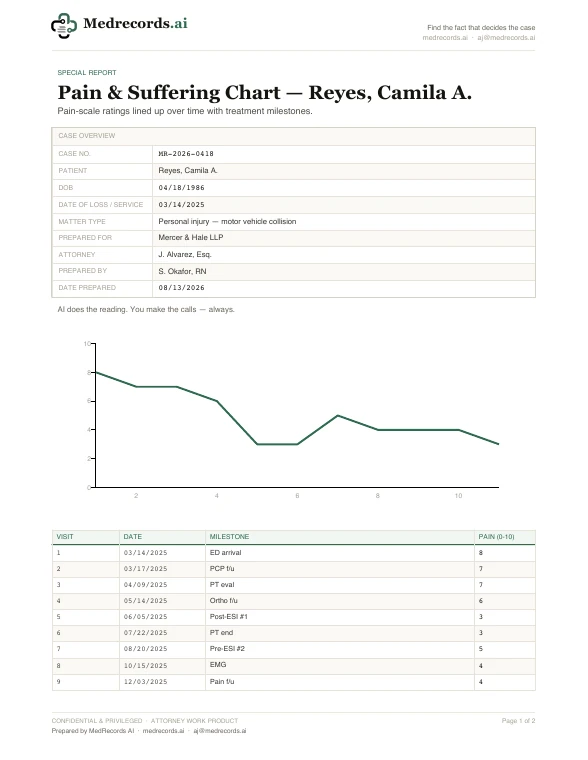
A chart of treatment activity broken out by quarter, from the date of collision through maximum medical improvement, so the pace and intensity of care is visible over time instead of implied by a long list of individual visit dates.
What’s inside
- Care activity broken out quarter by quarter
- Collision date through MMI covered in full
- Visit volume and type visible at a glance
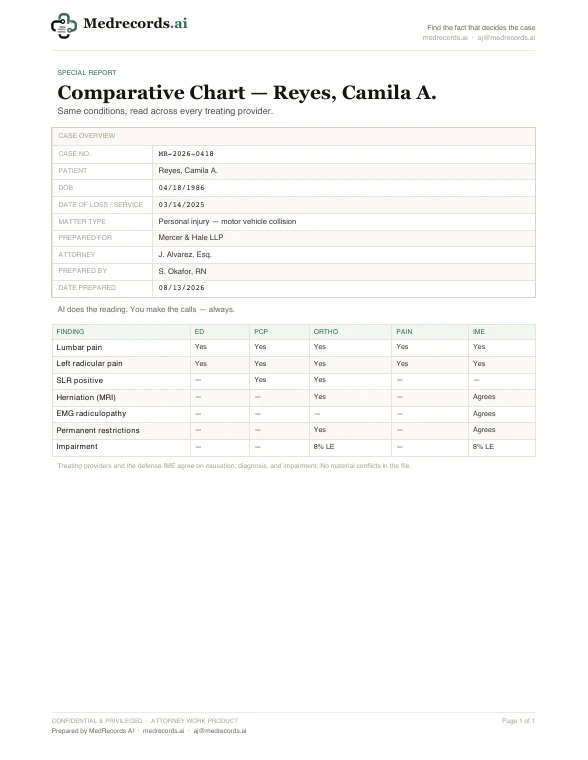
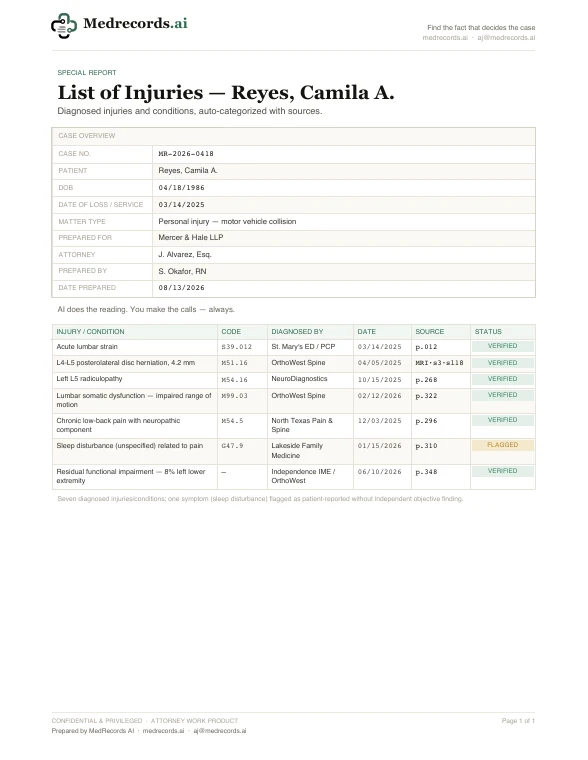
- Every entry cited to its source page
This is a real Medrecords AI work product on a fictional, company-branded demo case, not a template or a mockup. Open the PDF to see the actual formatting, citations, and structure a case team receives.
How Medrecords AI does this work
See how Medrecords AI turns a visit-by-visit chart into a quarter-by-quarter treatment picture.
SolutionPersonal Injury PlaintiffSee how Medrecords AI turns a visit-by-visit chart into a quarter-by-quarter treatment picture.Read more →ProductVerifiable AI citationsIf we can't cite it, we don't say it. Click any line to its source.Read more →BrowseAll 41 samples and toolsReports, chronologies, expert opinions, plus free templates and tools.Read more →
Test it on a file you already have.
Send one real record set. You get back a cited chronology and decide for yourself whether the read holds up — no obligation either way.